New Dynamics Bring New Challenges and Opportunities
Over the past few months, we’ve been talking about the combination of fit, intent and risk as it relates to account selection and go-to-market success in times of economic uncertainty. In this post, we’ll look again into the analysis we conducted on buyer intent signals in our Perspectives article, “Regaining Revenue Confidence in an Economic Crisis.”
Let’s cut to the chase. We noted three main observations based on D&B Buyer Intent signals and web traffic de-anonymization data we analyzed from March, near the onset of the COVID-19 pandemic, through June, as guidance was being issued to start reopening across the US.
- Work from home dynamic has impacted B2B digital identity resolution. IP-based matching has seen a negative impact due to the work-from-home dynamic, but cookie matching has seen a dramatic increase more than making up for the dip in IP-based identity resolution. In fact, we’ve seen a 2x increase overall in cookie-based identity resolution when comparing pre- and post-pandemic match rates. Don't let accounts that visit your website leave without having an understanding of the kinds of companies they are!
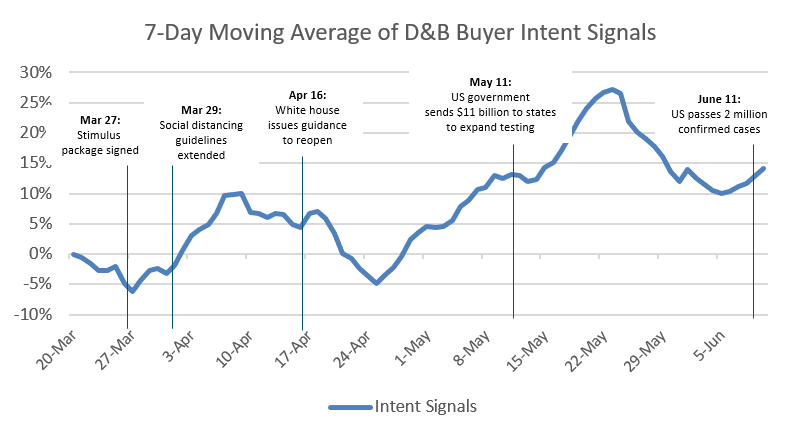
- The cautious re-opening across the US has resulted in a dramatic increase in in-market businesses. The slight dip in intent signals we saw right after the white house issued guidance to reopen on April 16th has seen a great recovery. When comparing pre- and post-pandemic intent signals, we’ve seen a 10% spike in organizations displaying intent signals – which we expect to further increase based on recent jobs reports which have shown unemployment figures declining.
- Select industries are thriving in the new normal with a spike in intent signals. Certain industries are benefiting from the impact of the pandemic on our daily lives. Specifically, we are seeing over 100% increase in intent signals coming from educational and HR services among others.
Before we dig into these observations, let’s ground on a few basic definitions of intent data.
First Party Intent
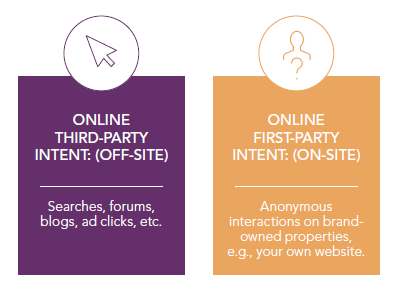
Known first-party intent data is information submitted voluntarily on web forms: name, company, job title, etc.
Anonymous first-party intent data comes from observations of accounts, on an IP or cookie level, that interact with your website and consume your content. The data is considered “anonymous” because you don’t know who the visitor is, what their role is, or which branch, office, location, or division they represent.
Third Party Intent
Third-party intent helps you understand the behavior of people and organizations in the market for your goods and services beyond your site across the web – targets you might otherwise be unable to discover. Combining both types of intent data – first-party and third-party – not only helps you identify customers but also reveals a more complete picture of the buyer’s journey.
 |
| Figure 1: The difference between first- and third-party intent. |
Combining both types of intent data can help you locate customers and reveal a more complete picture of your potential buyers and their buyer’s journey.
1. Work from home dynamic has impacted B2B digital identity resolution
A little background here is useful for those not familiar with how identity resolution solutions work. Generally speaking, identity resolution solutions rely on reverse-matching IP addresses that hit your website to a business. Larger organizations tend to have a dedicated IP address which can be matched to a corporate identifier.
The challenge is mostly with smaller businesses that use an Internet Service Provider (ISP) or those that work from home that also leverage an ISP such as Comcast or Verizon. This typically leads to false-positive matches, unless the solution has some sort of ISP classification system that can screen them out. With our recent acquisition of Orb Intelligence, we’ve seen a 30% lift in IP-based identity resolution with a stronger ability to screen out ISPs and resolve the identity of companies across the globe.
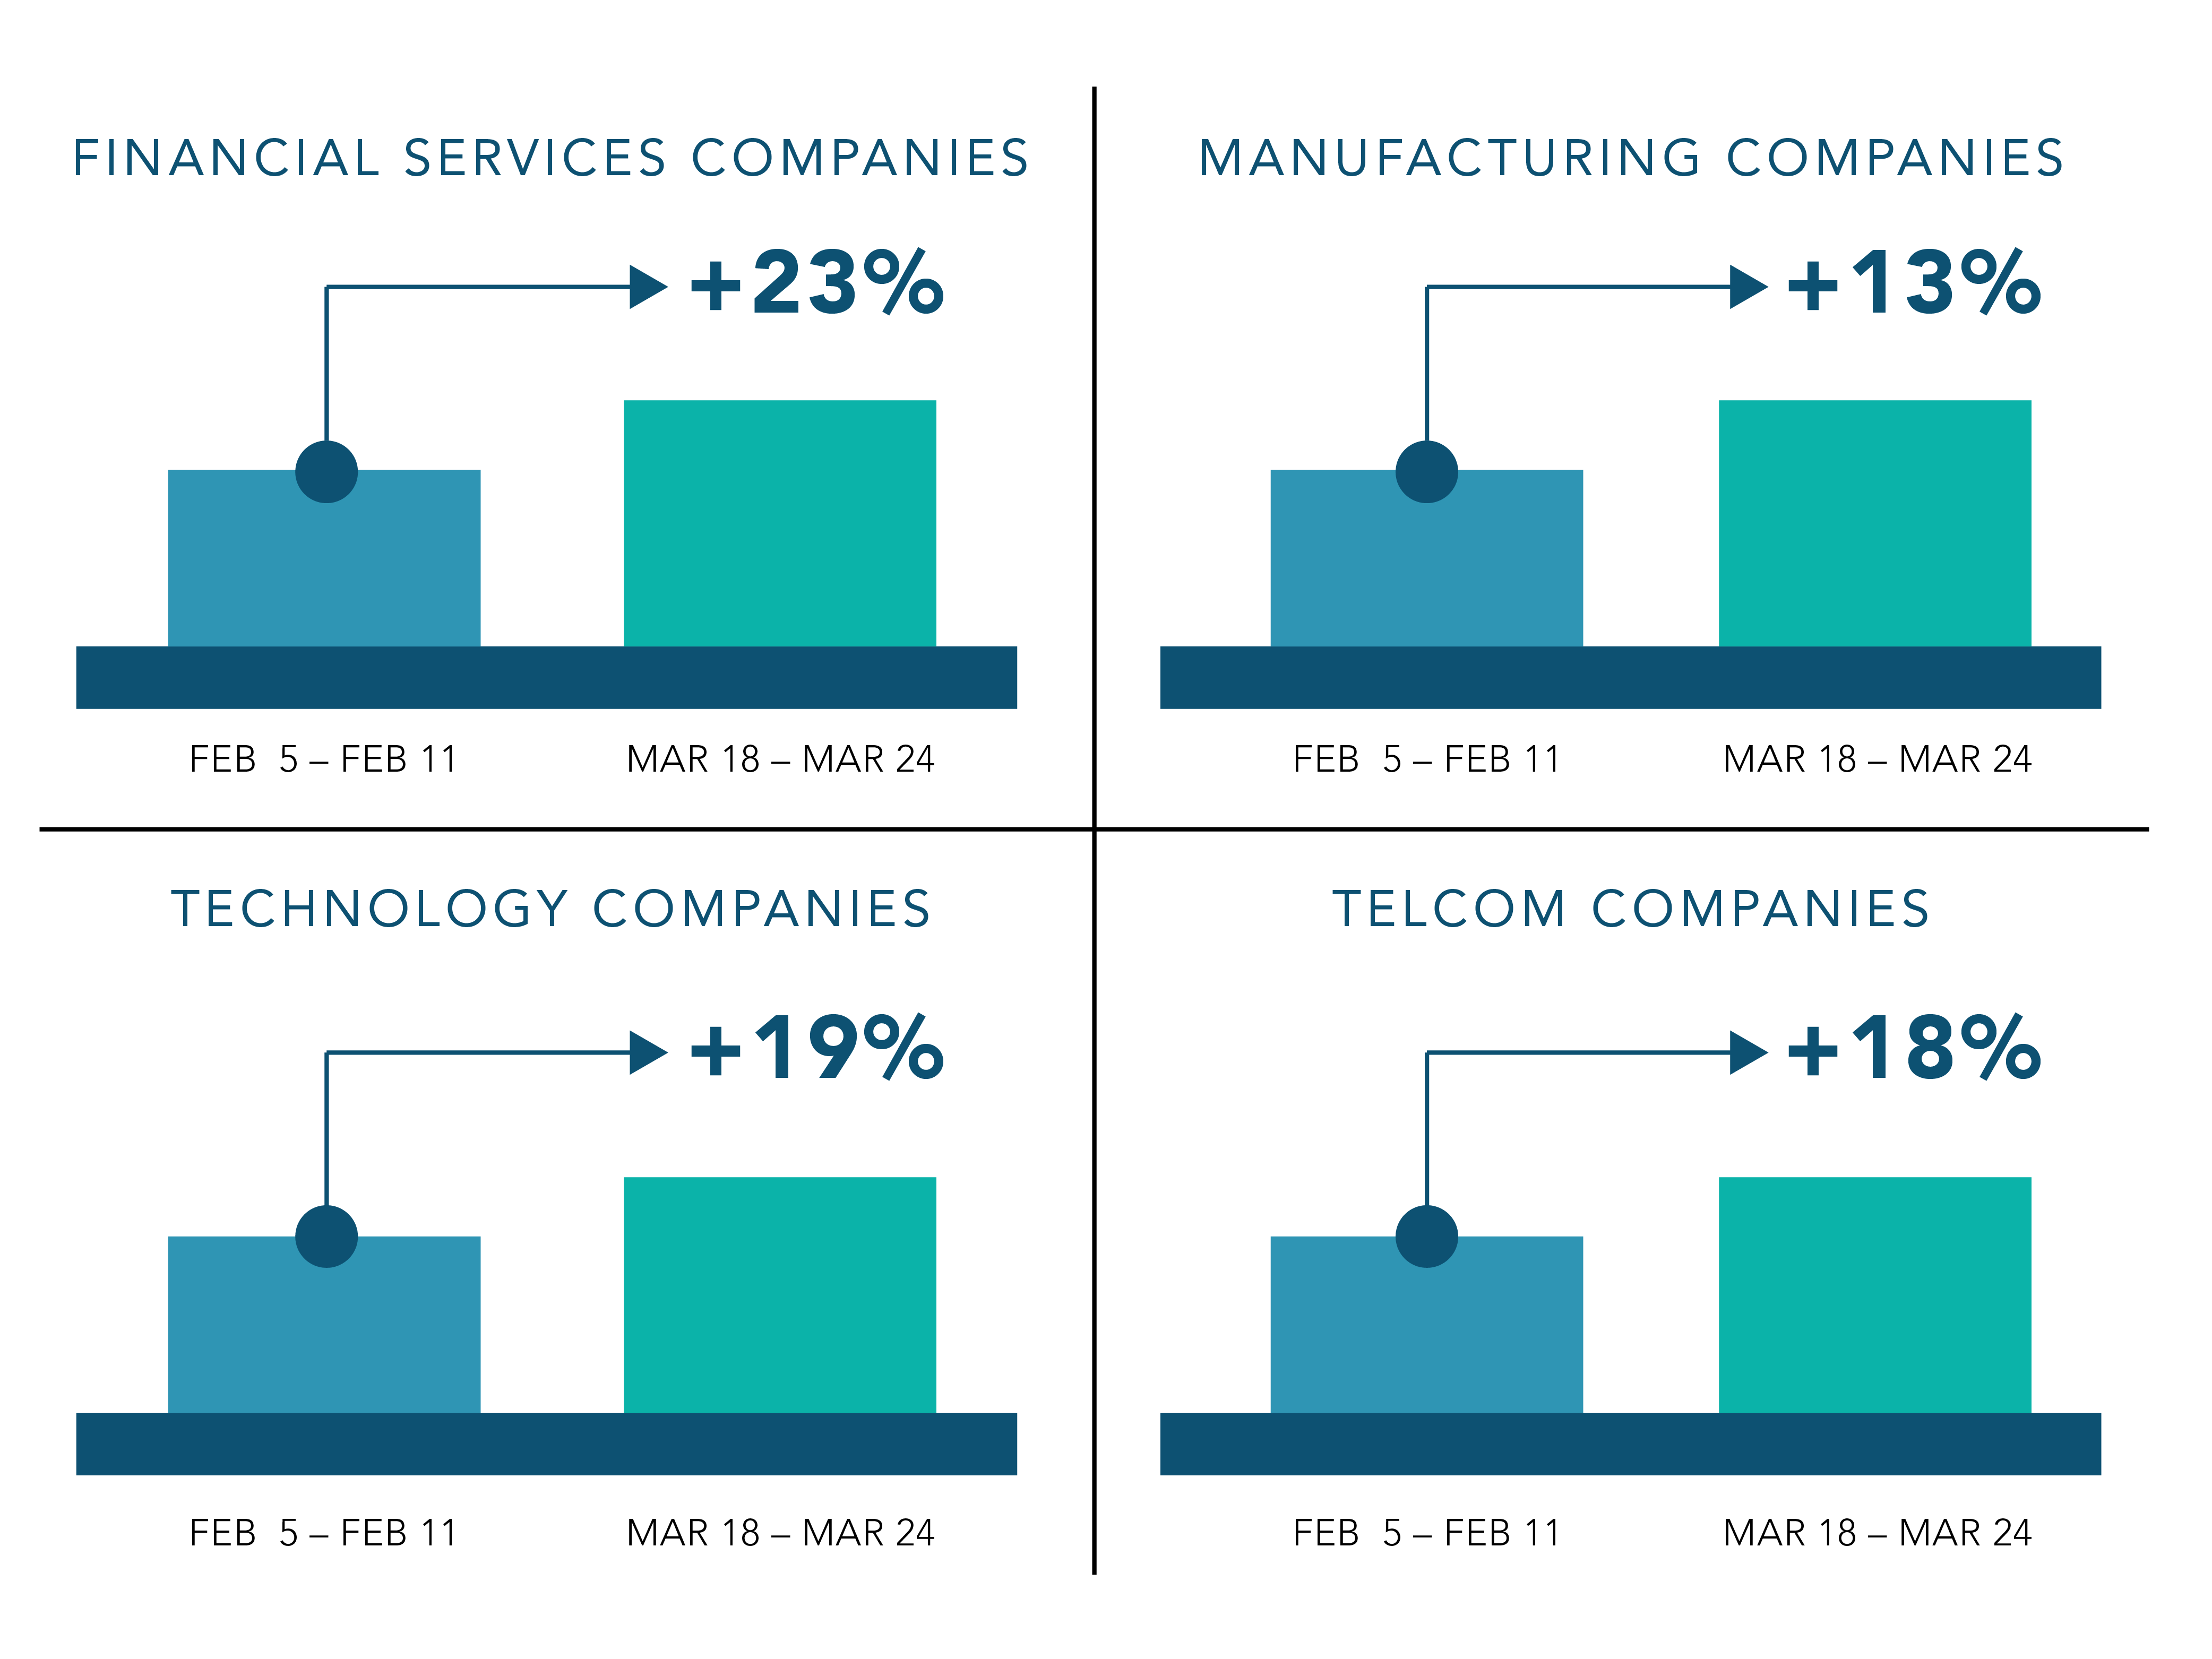
As the first 15-day lockdown was announced across most the US on March 16, we saw a dramatic spike in overall identity resolution. The initial spike ranged anywhere from 13% to 23% across key verticals as depicted in Figure 2. As we’ve had time to collect more data and analyze it further, we’ve noticed that cookie-based identity resolution has doubled, proving the effectiveness of this approach in a mass work-from-home scenario. When combining cookie and IP-based identity resolution, some of our customers are seeing match rates as high as 58% to all incoming site traffic.
When analyzing match rates, there are a couple of guidelines to follow:
- Make sure you are matching to an actionable data set. If you matched “Berkshire Hathaway” as a visitor to your site, it’s less useful than matching to a visitor that works at Geico’s headquarters in Maryland, as Geico is a subsidiary of Berkshire Hathaway. Granularity goes a long way for marketing and sales follow up success.
- Low match rates don’t necessarily indicate poor matching technology. Low match rates can indicate you’re attracting the wrong audiences to your website. As an example, if students or consumers are visiting your B2B solution pages, you need to refine targeting strategies to attract the right accounts and match audiences that matter to you.
The nuances of match rates aside, with many industry experts claiming that work-from-home will be the norm, and some companies offering benefits to work from home for the foreseeable future, leveraging this type of technology will become important to understand who and which companies are visiting your website.
 |
| Figure 2: The initial spike in cookie-based identity resolution in key industries as the pandemic began, as observed by Dun & Bradstreet, March 2020. |
2. The phased re-opening across the US has resulted in a dramatic increase in in-market businesses.
This might seem counter-intuitive at first, and we were certainly surprised to see this when we examined the data as well. But upon more thought, it made sense. While specific industries have been impacted (such as restaurants, hotels, and other industries requiring human interaction as depicted in my prior post) others have thrived.
Alex Schwarm, Dun & Bradstreet’s Vice President of Sales & Marketing Analytics, explains this dynamic: “While media outlets have been highlighting the negative impacts of the pandemic, beneath the surface many organizations are thriving. The work-from-home dynamic, increased digital focus, the stimulus package, and the guidance to re-open have benefited many organizations. Even so, traditional intent solutions look at web domains as a proxy for a company location and have limitations in understanding which company locations are engaging with digital content – and the relevancy of that content. We’ve solved this problem using location-based digital identity resolution and Natural Language Processing to map billions of content engagements to our corporate hierarchies coupled with very precise understanding of relevancy and intent.”
Looking at Figures 3 and 4, we see that both in-market companies and overall intent signals coming from these companies are highly correlated. Overall, we’ve seen a 10% increase in in-market companies when comparing pre- and post-pandemic intent signals. The slight dip observed after the white house announced guidelines to reopen appears to be a slight bump in the road, as the trajectory of intent has continued to rise. We expect these numbers to increase further as more buyers work-from-home, are limited in travel, and are forced to use digital means to research solutions to their problems. Overall, problems have not gone away – they’ve changed, and the way buyers search for solutions have become more digital than ever before.
 |
| Figure 3: 7-day moving average of in-market company locations as observed by Dun & Bradstreet. This differs from traditional intent solutions that track web domains as a proxy for a company and its location. |
 |
| Figure 4: 7-day moving average of intent signals observed by Dun & Bradstreet |
3. Select industries are thriving in the new normal with a spike in intent signals
As we further analyzed the intent signal data, we observed select industries seeing a spike in intent when comparing the periods before the lock down and the guidance to re-open. At the top of the list, we saw educational and HR services seeing a spike – potentially due to many families looking for alternatives to schooling and organizations seeking to aid their employees. Industries that require human interaction such as Real Estate and Repair Services saw a slight dip.
| Industry | Change in Intent from March 1 to April 15 |
|---|---|
| Educational Services | 100%+ increase |
| Real Estate | >15% decrease |
| Administration of Human Resources | 100%+ increase |
| Repair Services | >15% decrease |
| National Security & International Affairs | >50% increase |
| Water Transportation | >50% increase |
| Figure 5: Change in intent signals observed by Dun & Bradstreet across select industry categories during the pandemic | |
We’ll continue to keep an eye on these broader trends and share them with you to provide visibility at a high level. If you’re interested in learning more about intent signals tied to your specific accounts, request a complimentary intent reach report from Dun & Bradstreet.

